Earth at the Semiquincentennial


July 2026 marks the 250th anniversary of the American colonies’ Declaration of Independence from Great Britain. From a geological perspective, of course, two hundred and fifty years is merely the blink of an eye. Yet this particular quarter-millennium happens to include a geologically consequential explosion in human population and technology. So the US semiquincentennial seems a good time to look back on how the earth itself has changed in the last two hundred and fifty years.
From 1776 to 2026, the world’s plates continued their slow tectonic dance. Their movement has carried New York and Paris about twenty feet farther apart than they were in George Washington’s time. Australia is now roughly sixty feet closer to the equator, and the Hawaiian islands have crept thirty-something feet farther west of the hotspot that currently feeds the Kilauea volcano. As the plates moved, the crunching of their margins (and sometimes interiors) brought the usual crackling of earthquakes: lots of small ones and the occasional very big one. Since 1776, there have been literally millions of earthquakes big enough to feel (if anyone happened to be close enough to the source). Only a few thousand of those, however, were on a par with powerful shakes like the one that devastated Haiti in 2010. Of those, only seven were sufficiently shallow, powerful, and ill-placed to claim 100,000 or more lives. In other words, apart from a recent spate of moderate-scale human-induced earthquakes, planet earth has rattled along more or less as it has since the dawn of plate tectonics.
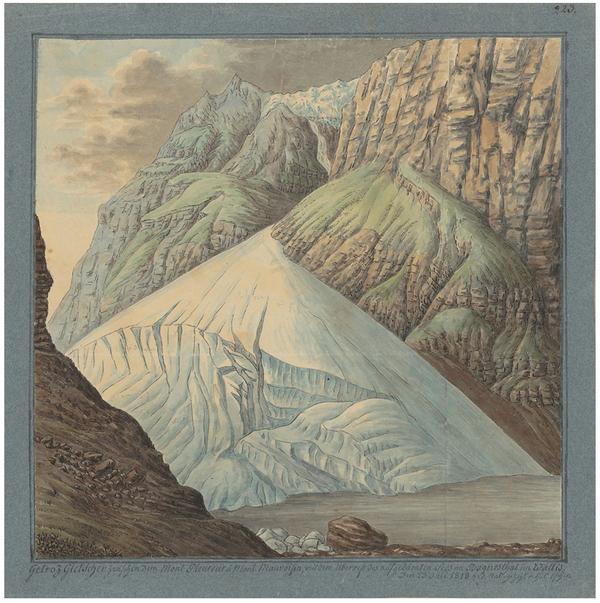
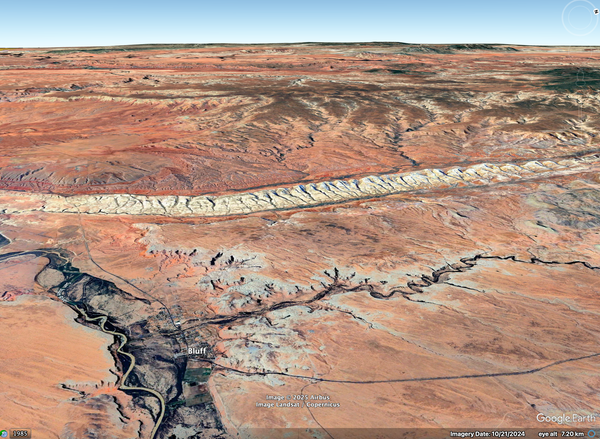
Landscapes are another matter. Historical reconstructions of global land use reveal major changes in land cover over the past two and a half centuries, as the images below reveal. George Washington wasn’t unusual in his enthusiasm for expanding agriculture and clearing land. Much of what was once forest, savannah, or grassland has been turned into crop and grazing lands.

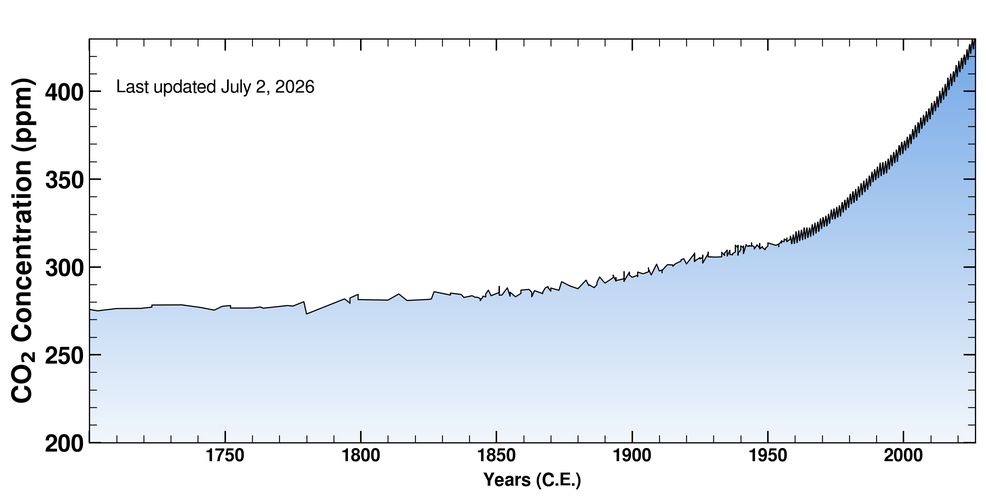
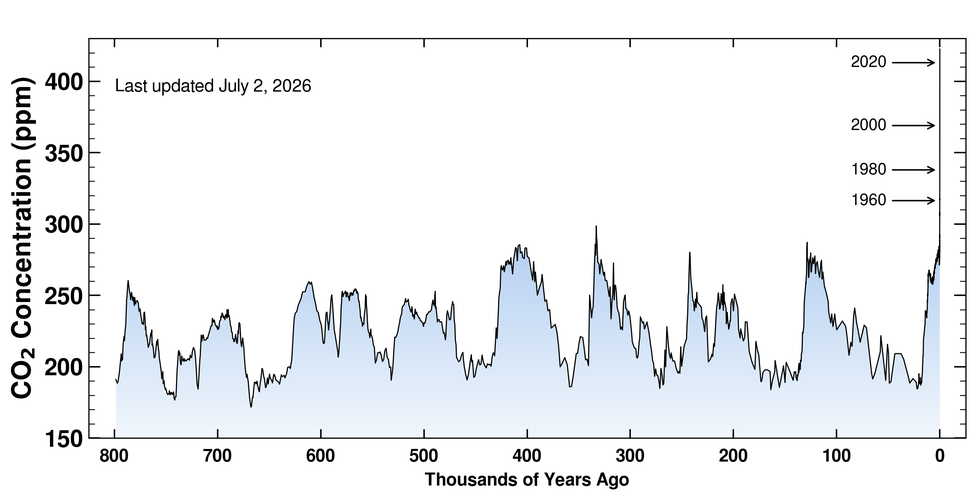
The air around us has changed too. Based on data from ice cores in Antarctica, we know that for the last 800,000 years, the carbon dioxide (CO2) content in the earth’s atmosphere has oscillated in tune with the ice ages, varying between about 180 and 280 parts per million (ppm). The level is higher during interglacial periods and lower during glacial periods (partly because cold ocean water, like a cold beer in the fridge, holds more dissolved CO2). Then the industrial revolution led to large-scale burning of coal, oil, and methane for energy. Just as the Swedish chemist Svante Arrhenius predicted in the 1890s, this burning of fossil fuels has driven CO2 steadily upward for the last century and a half, amplifying the greenhouse effect and warming the planet. Data on atmospheric CO2 through time from the Scripps Institute of Oceanography are shown in the graphs below. The first graph shows CO2 concentration since 1700; the second shows the full ice-core record stretching back 800,000 years. Across those eight thousand centuries before the industrial era, CO2 never rose above 300 ppm. George Washington and friends lived in a world with about 275 ppm. By the time the US celebrated its bicentennial in 1976, combustion had driven the level up to about 330 ppm. Now, on the eve of the USA’s 250th, CO2 concentration has topped 430 ppm.
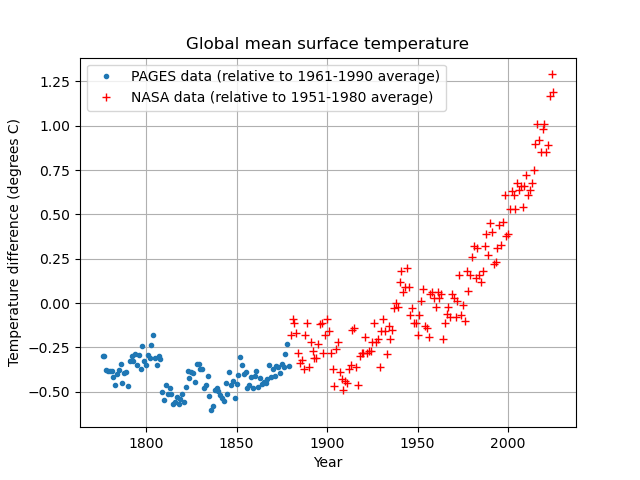
Carbon dioxide is a greenhouse gas. It absorbs infrared heat from the earth’s surface, and in so doing, warms the air. So, it’s natural to expect that the planet has grown hotter since Washington’s time. How much hotter? The graph below shows global mean surface temperature from 1776 to 2026. The data show that our world is roughly 1.5oC (2.7oF) warmer than George Washington’s. That might not sound like much, but heat powers the weather, and a little heat can go a long way. Furthermore, the extremes tend to grow faster than the average. Hence the powerful heat wave that struck Europe last week, and the one that is currently gripping a big chunk North America on this July 4th holiday weekend, both of which would have been virtually impossible in George Washington’s world.[1]
Benjamin Franklin would undoubtedly would have been impressed by coal-powered trains and gasoline-powered automobiles—and even more so by the electric power that he helped discover. From our vantage point in 2026, these are ancient technologies. As Bill McKibben writes in his wonderful new book Here Comes the Sun, we’re now in the midst of a new kind of revolution. It’s a quieter affair than the revolt of the American colonies in 1776, but also more consequential and far-reaching. Over the past decade or so, it has become cheaper on average to tap electricity from the sun and wind than to dig up and burn the dwindling remains of ancient plants and algae. As the cost of wind, solar, and battery storage continues to drop, the global build-out of renewables is rapidly accelerating. The energy transition is gathering momentum.
Now that seems like a revolution worth celebrating.
[1] This is based on a rapid attribution study by World Weather Attribution, which analyzed a measure of heat stress on the human body called the Wet Bulb Globe Temperature (WBGT). They concluded that “In a 1.4°C cooler climate, WBGTs as high as those forecast in early July 2026 would have been so extreme as to be virtually impossible.”
References and Further Reading
McKibben, Bill (2025) Here Comes the Sun. Norton.
PAGES2k Consortium (2017) A global multiproxy database for temperature reconstructions of the Common Era. Scientific Data, 4, 170088. doi: 10.1038/sdata.2017.88
Ritchie, Hannah (2021) Forest area. Published online at OurWorldinData.org. https://archive.ourworldindata.org/20260518-090244/forest-area.html (archived on May 18, 2026).
Roser, Max (2020) Why did renewables become so cheap so fast? Published online at OurWorldinData.org. Retrieved from: https://archive.ourworldindata.org/20251125-173858/cheap-renewables-growth.html (archived on November 25, 2025).